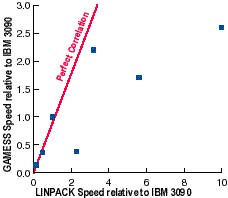
Figure 1. Computation chemistry vs LINPACK.
| Conventional Benchmarks as a Sample of the Performance Spectrum* | |
|---|---|
| John L. Gustafson | Rajat Todi |
| Ames Laboratory, USDOE | Ames Laboratory, USDOE |
| gus@ameslab.gov | todi@scl.ameslab.gov |
Abstract
Most benchmarks are smaller than actual application programs. One reason is to improve benchmark universality by demanding resources every computer is likely to have. But users dynamically increase the size of application programs to match the power available, whereas most benchmarks are static and of a size appropriate for computers available when the benchmark was created; this is particularly true for parallel computers. Thus, the benchmark overstates computer performance, since smaller problems spend more time in cache. Scalable benchmarks, such as HINT, examine the full spectrum of performance through various memory regimes, and express a superset of the information given by any particular fixed-size benchmark. Using 5,000 experimental measurements, we have found that performance on the NAS Parallel Benchmarks, SPEC, LINPACK, and other benchmarks is predicted accurately by subsets of HINT performance curve. Correlations are typically better than 0.995, and predicted ranking is often perfect.
The implicit purpose of all benchmarks is performance prediction. Individuals use readily-available personal computer benchmark ratings prior to purchase, expecting them to predict the performance. Government agencies use simplistic benchmarks like Peak Advertised Performance as the basis for national computing goals (e.g., "Petaflops"); implicit is the prediction that greater rated speed will lead to the solution of "Grand Challenge" problems. Benchmarks are used by the marketing divisions of computer manufacturers in the belief that they predict value of the computer (real or perceived) to the customer and can be used as a factor in pricing strategies.
This paper is about benchmarking benchmarks. We compare them based on this central issue: What is the maximum predictive information that can be obtained with the least time and effort?
To analyze and predict the performance of parallel and distributed computers, one must first be able to do it for a serial computer. The approach described here has proved equally applicable to both types of computer system.
At any given time, there are dozens of benchmarks used to compare computers. Some are fleeting, and others might have a lifetime of more than a decade. Some are targeted at supercomputers, some at personal computers, some at business computers. A primary source for us has been the Web page [1] maintained by A. Aburto Jr. Here are the benchmarks we survey in this paper:
This is the scalable benchmark that we conjecture may be a superset of other popular benchmarks, since it presents the full range of memory hierarchy performance whereas other benchmarks pick a particular problem size and measure execution time [6, 7]. It will be discussed in more detail below.
Maintained by a consortium of workstation vendors, SPEC is a frequently-changing collection of programs one might run on a workstation, plus kernels like matrix multiplication [5, 10, 11]. It is virtually impossible to track SPEC performance from one year to the next since the definition of the problem set is always changing, but we select SPECint_95 and SPECfp_95 for this study.
This is the linear algebra library routine for solving a general dense system of equations with partial pivoting [4]. It has countless variations, but survives mainly in its original 100 by 100 size, a 1000 by 1000 size, and a scaled version. It is discussed in more detail below.
A collection of parallel algorithms related to computational fluid dynamics, formerly maintained by NASA/Ames Research Center [2, 9, 10]. The NPB provide the main test case of our thesis for parallel benchmarking.
This is usually obtained by figuring the rate at which the floating-point adders and floating-point multipliers in the hardware can fire, unfettered by any other operation.
STREAM is a small collection of very simple loop operations [12]. It tries to estimate the total rate at which all addressable memory spaces can deliver data to their respective processors, unfettered by any other operation. For the "peak" measure, effects such as memory refresh, input/output interrupts, or other burdens on the memory bus, are usually ignored in favor of simply multiplying the bus width in bytes by its maximum repetition rate.
The Lawrence Livermore Loops, designed by Frank McMahon by taking excerpts from Fortran application programs used at Lawrence Livermore National Laboratories.
This is the latest version of the 1976 Whetstone benchmark [3] written in C. It stresses unoptimized scalar performance, since it is designed to defeat any effort to find concurrency. When MIPS ratings were in favor, the Whetstone benchmark was a popular way to estimate MIPS, and one occasionally sees "WIPS" (Whetstone Instructions Per Second) in the historical literature.
These are assorted integer and floating-point benchmarks [1] that serve mainly as examples of too-small problems for the purpose of this study. As with peak measures, we intentionally include benchmark approaches of dubious merit to test the hypothesis that they reveal only part of a larger picture.
One might expect correlation between benchmarks, and hope for rough correlation between a benchmark and an application. One hopes for an approximately linear relationship. Failing linearity, one might hope for monotonicity. But many relationships between benchmarks and applications (or between benchmarks and other benchmarks) fail monotonicity. It is not at all uncommon to find relationships much more like that shown in Figure 1.
In this case, the horizontal axis represents LINPACK performance and the vertical axis represents performance on the GAMESS computational chemistry application, both normalized to an IBM 3090 = 1.0. This data was measured by S. Elbert at Ames Lab, circa 1989. The correlation is still positive, but that may be faint comfort to the chemist who buys one of the computers well below the diagonal based on the benchmark.
The qualitative feature that has been lost is correct ranking. Absolute performance may not be as important as the one-dimensional ranking. This requires that the scatter plot describe a monotonically increasing function. It is easier to obtain a correlation close to 1.0 than to obtain perfect ranking, a nonparametric statistic.

Figure 1. Computation chemistry vs LINPACK.
Correlation might not even be positive. Consider this data for the crudest of all benchmarks (and also one of the most popular), peak FLOPS rating, versus actual FLOPS measured by the first of the NAS Parallel Benchmarks:
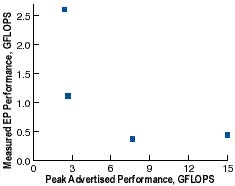
Figure 2. Peak FLOPS versus EP benchmark.
The correlation is obviously negative. It is -0.692, to be precise. From this, it should be evident that benchmarks are not equivalent within some approximate scale factor; proportionality is not even a loose guideline. This is why benchmarking computers remains an unsolved problem.
The graph in Figure 2 shows what can happen when Peak Advertised Performance (PAP), typically based on a register-to-register timing, is applied to a real application where the operands must come from some level of main memory. If one is picking a benchmark as crude as a peak rating, one would do better to pick memory bandwidth since it has long ago replaced floating-point speed as the bottleneck for computer performance. Look what happens when we replace PAP with memory bandwidth as a predictor of the performance on "EP":
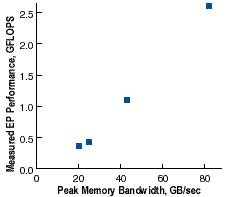
Figure 3. Peak bandwidth versus EP benchmark.
The correlation has gone to the other extreme. For EP, at least, peak memory bandwidth is an excellent predictor. The correlation coefficient is 0.9987 in this case. But of course someone had to know which peak machine rating to use, and as scientists we seek to remove such arbitrariness in the metric.
4. Universal (and valid) criticisms
The casual critic of computer benchmarks usually says one or two (quite valid) things:
1) "The only thing that matters is how the computer performs on my problem. I don't believe in benchmarks. They don't test the computer the way I use it in my application."
2) "That benchmark is just a toy problem. Why don't they just measure full-sized applications? We used benchmark XYZ and it didn't correlate at all with what we actually got out of the 8 gigabyte computer."
We use the term "casual critic" because while the problems with benchmarking are obvious, the solutions are not at all straightforward. Few people can do as suggested by Criticism 1 when selecting a computer to purchase. The vendor cannot supply times for every potential customer's application mix. Important customers can sometimes demand that a vendor port and time the applications a customer wants, and marketing departments support divisions dedicated to this task. It is a very costly procedure, especially if the computer architecture or environment is novel which is also the situation where a customer is most likely to demand a benchmark prior to purchase.
That leads to Criticism 2: Vendors or users choose a problem that is portable from one machine to another and has a popular following. To make it fit all different computers, it is usually small and simple. For it to have a popular following, it helps to have an easily-understood task like "matrix multiply" or "solve linear equations," which makes the code itself small. To be fixed in size and yet fit the memory of every computer, it has to have small data structures. It typically does not measure input and output, since those things are erratic and difficult to measure and also make the overall performance look much worse. The result is, indeed, a "toy problem." Unless designed very carefully, the simplified problem loses salient characteristics of real applications.
Hence there is a tradeoff between the accuracy of a performance measurement (put the target applications on the target machine and see how well they run) and ease of a performance measurement (just look at an easily-measured performance for a simplified task).
Criticisms 1 and 2 sound alike, but have subtle differences. Criticism 1 observes that every application has a different feature emphasis more conditional branches, fewer square roots, etc. Hence, it makes little sense to use a benchmark with one feature mix to measure an application with a very different emphasis. Criticism 2 observes that small task performance doesn't always predict large task performance. The dominant reason is that memory is not flat; as problems grow in size, they use progressively slower memory regimes: registers, primary cache, secondary cache, main memory, and mass storage.
Regarding Criticism 1, we observe that many benchmarks do not use mainstream feature emphasis. They stress processor activity (arithmetic operations) and not memory activity (data motion), which speaking very generally is the opposite of real-world applications. 32-bit and 64-bit floating-point performance is often incorrectly treated as interchangeable. So are character, 16-bit, and 32-bit integer performance.
Regarding Criticism 2, we observe that most benchmarks are so small that the data structures reside in cache, whereas most applications are so large that they use most of the main memory. Memory is incorrectly assumed "flat." Conversely, a large-memory benchmark like SPEC might not represent behavior on a cache-intensive job.
There is a Hindu fable of six blind men who touch different parts of an elephant and come up with radically different descriptions of it a tree, a wall, a snake, etc. Benchmarking is very much like this; single benchmarks sample computer behavior at a point, and one has a tendency to overgeneralize from that sample.
To deal with this, benchmarks such as PERFECT [5] and SPEC throw in a suite of applications, thinking this will test the multidimensional aspects of system behavior and give a more complete picture. Doing so is certainly more likely to exercise a representative mix of instruction types. The resulting suites are very expensive to port to different computers, especially parallel computers, and can take hours to execute once converted.
Unfortunately, all of these application suites remain point samples in the one respect for which the testing of a range is most important: They fix the size of the problem. Whatever weighting they contain for using different memory regimes, it is not variable. Since the benchmark must fit on many computers, the size chosen is typically that of the smallest computer in the set targeted for study. The original NAS Parallel Benchmarks were all sized to the Cray X-MP system at NASA Ames Research Center [2], even though the parallel computers had much larger memories and were designed for running much larger problems. In wrestling with the scalability of parallel computers, they have evolved five different sizes of their benchmarks but still have no way of comparing computers having very different memory capacities. Largely because of this, support for the NPB has ceased.
McMahon's work with the Livermore Loop benchmarks [8] shows an early effort to explore different problem sizes within one benchmark. Vector lengths are varied over a small range, and the user of the benchmark is encouraged to study the statistics thus produced. However, the range is far from large enough to span several memory regimes (a size ratio of a million to one is about right to test regimes on 1997 vintage computers) and the Livermore Loops are universally quoted as single-number summaries, ignoring the underlying structure of the test.
Also recognizing the "Blind Men and the Elephant" syndrome, Curnow and Wichmann designed the Whetstone benchmark to have adjustable weights for different machine features such as integer math, subroutine calls, special functions, branching, and so on [3]. The user was encouraged to find the weighting used in the target application, adjust the benchmark weights, and then use the total score as a predictor. This attempt at multidimensional reporting has also been ignored, and the weightings that come with the Whetstone code as defaults are the ones always used for comparison.
In the U.S. economy, we assume some monetary inflation is inevitable, and attempt to correct for it using the Consumer Price Index. The mental adjustment needed in hearing a dollar figure and a year is something we all learn to do. We know better than to use a 1978 house assessment in figuring a reasonable price for it today.
Moore's law notes a performance increase of about 60% per year, far higher than U.S. inflation has ever been. Yet, we do not account for this inevitable change when designing benchmarks. Every benchmark based on timing a fixed-size problem is doomed to look ridiculously small after only a few years.
The LINPACK benchmark [4] began by specifying that the matrix to factor must be 100 by 100. As computers got so large and fast that this problem ran in less time than it takes to press the ENTER key and with less memory than a scratch buffer, the problem size was increased to 300 by 300. Then 1000 by 1000. Then, at the suggestion of the first author, Jack Dongarra allowed a version "as large as will fit in memory." But by Moore's law, memory goes up by a factor of four every three years. The operation count increases as the cube of the memory, or a factor of 64. If the processing speed also follows Moore's law and increases by 4x, the time to run "scaled LINPACK" will increase by a factor of 16 every three years! In a way, this makes scaled LINPACK as surely doomed as fixed-size LINPACK. Benchmarking is ultimately limited by the same thing that limits application problem size: the time people are willing to wait for an answer. Human patience is fairly constant; it does not follow Moore's law.
The LINPACK 100 by 100 benchmark is still in use. For machines near the top of its list, it requires less than 10-5 of the available memory and executes faster than a nerve signal can travel from the eye to the brain to see the result. Evidently, most benchmarkers do not believe in Moore's law. If they did, benchmarks would be designed from the beginning to be exponentially scalable.
The HINT benchmark was created in 1995 at Ames Laboratory by the first author and Quinn Snell. It is infinitely scalable, including precision considerations. Space does not permit a detailed discussion of its design, but the reader is referred to [6, 7] for details. The salient points needed here are as follows:
Figure 4 shows a pair of typical HINT curves for a workstation. The form of the HINT curves reveals machine "personality." The farther left the curve starts, the lower the latency of the system. Note how the 64-bit performance has several dropoffs, marking the end of primary cache, secondary cache, and main memory. This workstation has good performance over a broad time scale. It has enough main memory to show high speed for tasks in the several-second range. After a few seconds, it runs out of memory and performance falls with use of disk storage.
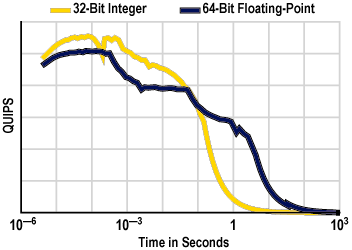
Figure 4. Typical HINT curves.
For the graph in Figure 4, imagine that the two curves are both for floating-point data, but from different computers. Say the dark line is for Computer A, and the light line is for Computer B. Which one is "faster?" A benchmark that samples mainly the millisecond range will show Computer B to be faster. A different benchmark that samples mainly the part of the graph above 1 second will show Computer A to be much faster. This is our thesis:
Different rankings of computers at different tasks can often be traced to HINT curves that cross.
If the HINT curve for computer A is uniformly greater than that for computer B, than it should be very difficult to find a benchmark or application that ranks B as having higher performance than A. If this conjecture is true, then the various benchmarks in common use are sampling the performance curves described by HINT, like the blind men sampled the shape of the elephant. Use of an application benchmark suite to derive a single performance number may give a better sampling distribution than a kernel benchmark, but it produces no more insight into why the performance is what it is, or how to predict performance of a completely different task.
It is also useful to plot HINT graphs with bytes of storage as the horizontal axis instead of time. This makes it easier to pick out the size of memory regimes, but harder to compare computers of very different performance. (With time as the horizontal axis, one can easily put a very slow and a very fast processor on the same horizontal scale; with memory as the horizontal axis, the two graphs will differ greatly in both horizontal and vertical directions.) While we encourage the use of time as the horizontal axis, we might more easily correlate HINT with other (fixed-sized) benchmarks if we use problem size in bytes.
Different benchmarks sample different instruction mixes, and different memory regimes. This is a major reason why rankings differ depending on benchmarks. Clearly, one could define a problem that depended heavily on disk output and another problem that depended on floating-point multiply-add operations, and show different rankings for business and scientific computers.
While it is obvious that the possible differences in feature emphasis are vast, we conjecture the following:
The main difference between feature emphasis in benchmarks is the dominant data type.
Thus, graphics benchmarks operate on pixels, scientific benchmarks use floating-point numbers, business benchmarks use integers and character data. We can select a HINT measurement that uses that dominant data type.
The other major difference between benchmarks is the "computational intensity" or the ratio of operations to memory references. For example, matrix multiplication and LINPACK have very high computational intensity, whereas Dhrystones and STREAM are very low. But the issue may not be the ratio of operations to references so much as the location of the data. Every operation implicitly references data, and perusal of the code may reveal a register or memory source. But on modern architectures, the data actually can come from registers, primary cache, secondary cache, main memory, or mass storage (virtual memory), with performance that can range over a factor of a thousand. This leads to our second conjecture:
The main difference between "computational intensity" or "size" of a computer benchmark
is the time spent in different memory regimes.
Figures 2 and 3 can be explained by HINT graphs. Peak MFLOPS corresponds to the left extreme of the HINT graph, with arithmetic from registers and primary cache. Peak memory bandwidth corresponds to the right extreme of the HINT graph, where the problem is so large that memory speed becomes limiting. We can select a part of a HINT graph that represents the size of another benchmark or application in question.
To test these conjectures, we use a collection of Silicon Graphics computers of seven different configurations, an ASA Pentium Pro PC running Linux, and a single processor of a Cray C90. We also ran parallel systems: SGI Onyx, IBM SP-2, Cray T3D, and nCUBE2S. (The machines do not have to be current to test our theory.) They vary in processor count, clock speed, cache structure, and floating-point capability relative to clock speed. Because the SGI workstations have similar product names, we name the five distinct configurations "Indy 1," "Indy 2," and so on. The characteristics and HINT graphs for workstations are shown in Table 1 and Figure 5.
| Table1 | ||||||
|---|---|---|---|---|---|---|
| Workstation characteristics | ||||||
| Indy 1 | Indy 2 | Indy 3 | Indy 4 | Indy 5 | PC | |
| MHz | 133 | 100 | 133 | 100 | 200 | 200 |
| CPU | R4600 | R4400 | R4600 | R4600 | R4000 | Pnt. Pro |
| Primary Cache | 16 KB | 16 KB | 16 KB | 16 KB | 16 KB | 16 KB |
| Secondary Cache | 0.5 MB | 1.0 MB | none | none | 1.0 MB | 0.5 MB |
| RAM | 64 MB | 64 MB | 64 MB | 64 MB | 64 MB | 64 MB |
| Operating System | IRIX 6.2 | IRIX 6.2 | IRIX 6.2 | IRIX 6.2 | IRIX 6.2 | Linux |
| Compiler | Mips C | Mips C | Mips C | Mips C | Mips C | gcc |
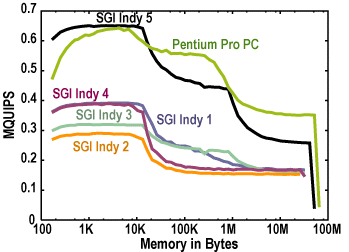
Figure 5. HINT for workstations.
Note that the HINT graphs distinguish the memory hierarchies; a practiced eye can read the size of primary and secondary cache (if any), available RAM, etc. as described in Section 7.1.
The range of performance here is intentionally small, so that correlation testing is sensitive to subtle differences and not merely confirmation of gross speed differences. Of particular interest is the crossing of the curves for the Pentium Pro PC and the fastest SGI Indy at about 16 KB. This should be reflected in different rankings on different benchmarks. Our results confirm this.
| Table 2 | |||
|---|---|---|---|
| High-speed uniprocessor characteristics | |||
| SGI Challenge | SGI Onyx | Cray C90 | |
| CPU MHz | 194 | 194 | 250 |
| CPU Type | R10000 | R10000 | Vector |
| Primary Cache | 32 KB | 32 KB | none |
| Secondary Cache | 0.5 MB | 1.0 MB | none |
| Main RAM | 0.5 GB | 0.5 GB | 2.0 GB |
| Operating System | IRIX 6.2 | IRIX 6.2 | UNICOS |
| Compiler | Mips C | Mips C | Cray C |
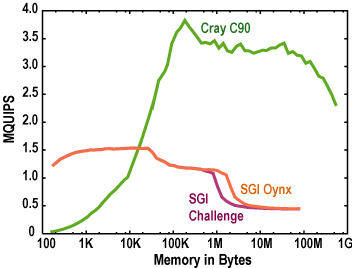
Figure 6. HINT for high-performance computers.
For the high-speed uniprocessors in Table 2, the crossover in the HINT graphs (Figure 6) is profound. The curve shown is for a vectorized version of HINT; an unvectorized version runs 7 times slower. The Cray curve resembles curves for parallel processors, with a slow rise to a much higher plateau. The two SGI computers are almost identical except for the difference in memory size.
We also will show results for four types of parallel system: IBM SP-2, nCUBE 2S, Cray T3D. and SGI Onyx. HINT is very easy to port to any parallel computer, whether distributed or shared memory. Though not shown in the following table, both thin and wide versions of the SP-2 were tested. Only the SGI has a secondary cache, and it is the only parallel computer that exhibits a tiered effect in its HINT graph.
Parallel computers, especially those using explicit message passing, are low in performance in the short time scale (below about 100 microseconds). In this respect their strengths are the opposite of the modern RISC workstations with caches and nimble context switching. HINT curves of parallel computers show that benchmarks that focus on small data sets and quick loop structures will misrepresent parallel computers as slow or useless. Ames Lab maintains benchmark data for dozens of systems (see http://www.scl.ameslab.gov/HINT).
| Table 3 | ||||
|---|---|---|---|---|
| Parallel System Characteristics | ||||
| SGI Onyx | nCUBE 2S | Cray T3D | IBM SP-2 | |
| Number of Processors | 1, 2, 4, 8 | 16, 32, 64, 128 | 32, 64 | 8, 16, 32, 64, 128 |
| CPU MHz | 194 | 25 | 150 | 67 |
| CPU Type | R10000 | custom | Alpha EV4 | RS6000 |
| Primary Cache | 32 KB | | 32 KB | 256 KB |
| Secondary Cache | 2 MB | | | |
| Main Memory | 2 GB (8-way) | 4 MB per node | 64 MB per node | 128 MB per node |
| Operating System | IRIX 6.2 | Vertex | UNICOS | AIX 3 |
| Compiler | Mips C | cc | C 4.0.3.5 | mpcc |
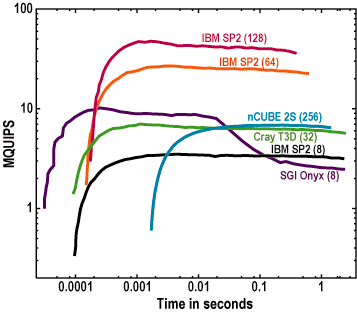
Figure 7. HINT for parallel computers.
For over 30 benchmarks and 30 computer systems, we filled out the table of performance as a first step (about 1000 experimental measurements). HINT was also sampled at 126 (floating point) and 106 (integer) points (about 4000 experimental measurements). MATLAB was then used to compute the following:
The curve resulting from (1) represents what we call the application signature. It shows the emphasis on different parts of memory, instantly revealing whether a test stresses cache, main memory, or some unusual pattern.
The SPEC 95 benchmark comes in integer and floating-point flavors, explicitly declaring the data type. Both integer (8 benchmarks) and floating-point (10 benchmarks) suites use large arrays that potentially exercise much of any secondary cache. The integer benchmarks are poor at revealing any shortcomings in main memory speed. The first "HINT Sample" column is the memory size giving the best correlation; the second "HINT Sample" column is the memory size giving the most accurate ranking.
| Table 4a | ||||
|---|---|---|---|---|
| Integer HINT versus SPEC 95int | ||||
| Benchmark | HINT Sample | Correlation | HINT Sample | Rank Correlation |
| go | 27 KB | 0.9964 | 468 KB | 0.996 |
| m88ksim | 39 KB | 0.9985 | 164 KB | 0.996 |
| gcc | 180 KB | 0.9970 | 514 KB | 0.996 |
| compress | 290 KB | 0.9990 | 164 KB | 0.996 |
| li | 17 KB | 0.9947 | 164 KB | 0.996 |
| ijpeg | 198 KB | 0.9986 | 164 KB | 0.992 |
| perl | 36 KB | 0.9989 | 164 KB | 0.979 |
| vortex | 180 KB | 0.9985 | 514 KB | perfect |
| SPEC int | 180 KB | 0.9996 | 514 KB | perfect |
| Table 4b | ||||
|---|---|---|---|---|
| Floating Point HINT versus SPEC95fp | ||||
| Benchmark | HINT Sample | Correlation | HINT Sample | Rank Correlation |
| tomcatv | net | 0.9990 | 4963 KB | 0.996 |
| swim | net | 0.9998 | 4963 KB | 0.983 |
| su2cor | 893 KB | 0.9970 | net | 0.996 |
| hydro2d | 1080 KB | 0.9983 | 4963 KB | 0.996 |
| mgrid | 29 KB | 0.9977 | net | 0.996 |
| applu | net | 0.9997 | 4963 KB | 0.992 |
| turb3d | 16 KB | 0.9994 | net | 0.996 |
| absi | 1080 KB | 0.9979 | net | 0.992 |
| fppp | 29 KB | 0.9933 | 16 KB | 0.996 |
| wave5 | 893 KB | 0.9962 | 4101 KB | perfect |
| SPEC fp | 893 KB | 0.9984 | 4101 KB | 0.996 |
The "net" entry means the integral of the entire HINT curve provided the best correlation. SPEC performance can be estimated from HINT by
spec95int 7.5 x (MQUIPS at 180 KB), max. error 15%
spec95fp 11. x (MQUIPS at 893 KB), max. error 23%
If HINT and SPEC provide similar information, one would then need to ask which benchmark is more repeatable, easier to port, and takes less time to run,
In running SPEC on two identical workstations, we found variations in the SPEC ratings up to 7%. The difference between HINT runs never exceeded 1%. We also are unable to obtain ratings as high as those published by the vendors. The original SPEC suite was based on a VAX-11/780 speed defined as 1.0; yet, when run on a VAX-11/780 the VAX got a SPEC rating of 3, implying it is three times as fast as itself. "Compiler improvements" are the usually cited explanation. In any case, variation in SPEC measurements is exceptionally high.
It takes about one day to run SPEC on a dedicated workstation. HINT takes about 10 minutes per data type tested, or 20 minutes for both 32-bit integer and 64-bit floating-point measurements. This represents a ratio of about 100:1. It does not appear that taking 100 times as long to run a benchmark yields 100 times more information. If anything, it yields less information since statistical variation is less easily controlled by multiple trials.
While the statement that real applications make the best benchmarks is intuitively appealing, one can do as well or better with a reduced problem that has been carefully designed to capture the behavior of a computer on different data types and in different memory regimes. SPECfp does a better job than most benchmarks of exploring large memory behavior, as we will see.
The application profile of hydro2d is particularly interesting:
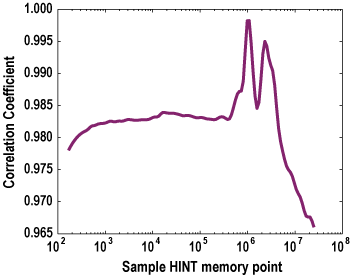
Figure 8. hydro2d application profile
The twin peaks probably indicate the exercising of two arrays that differ in size by about a factor of four. As with many of these examples, the correlation coefficient seldom drops below about 0.95. When it does, it indicates that the HINT curves cross one another as described in the first few sections; then it is critical to pick the right point.
During the 1980s especially, LINPACK became the benchmark darling of scientific computer vendors. It is one of the few benchmarks that correlates well with Peak Advertised Performance in terms of FLOPS. It exercises the ability of a processor to do independent multiply-add operations on contiguous local storage and registers, something easy to optimize in hardware.
In purchasing computers for computational chemistry applications at Ames Lab we discovered that LINPACK frequently overpredicted application performance by a factor of 10. HINT provides a graphical explanation of this phenomenon. Since the 100 by 100 LINPACK slightly exceeds primary cache (80 KBytes maximum), it tends to overstate performance on machines with a mismatch between floating-point speed and main memory bandwidth. LINPACK performance can thus be estimated by looking at the left extreme of the HINT curve where the main memory regime is not used. For many scientific computers, performance drops catastrophically once a problem becomes too large to fit in cache. (On older Cray mainframes, the nominal main memory is static RAM and serves as the secondary cache regime; the SSD is dynamic RAM and is effectively the main memory for applications. Hence, Cray mainframes suffer the same performance dropoff as RISC workstations.)
Table 5 summarizes correlation experiment results.
| Table 5 | ||||
|---|---|---|---|---|
| HINT versus LINPACK | ||||
| Benchmark | HINT Sample | Correlation | HINT Sample | Rank Correlation |
| 100x100 | 29 KB | 0.9971 | 4963 KB | 0.983 |
| 1000x1000 | 4512 KB | 0.9968 | 2801 KB | 0.967 |
Again, HINT appears to hold a superset of the information in the other benchmark. One can predict the LINPACK scores using
100 by 100 LINPACK MFLOPS (rolled)
49 x (MQUIPS at 29 KBytes), max error 51%
1000 by 1000 LINPACK MFLOPS
54 x (MQUIPS at 4.5 MBytes), max error 14%
The different emphasis on large memory regimes is made clear by the application signature for LINPACK, shown in Figure 9. LINPACK tends to operate on single vectors and submatrices, which fit in caches. The second peak shows the need to sometimes sweep through the entire matrix.
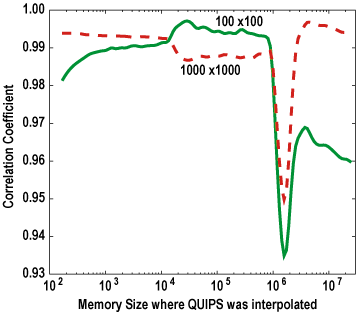
Figure 9. Application signature for LINPACK.
The NAS Parallel Benchmarks [2, 9, 10] provide data we can compare with HINT curves for various-sized ensembles of SGI, SP-2, T3D and nCUBEcomputers. The SP-2 in particular resembles a distributed computer system more than a parallel computer in the older sense. We used "Class A" and "Class B" sizes of the NPB. Space does not permit detail, but correlations are excellent as shown in Table 6. The NPB is another benchmark suite which is very expensive to convert and tedious to run. HINT predicts the performance within a few percent within one vendor product line, and within a factor of two when predicting widely varying architectures.
| Table 6 | ||||
|---|---|---|---|---|
| HINT versus NAS Parallel Benchmarks | ||||
| Benchmark | HINT Sample | Correlation | HINT Sample | Rank Correlation |
| EP Class A | 4.3 MB | 0.9943 | 0.4 MB | 0.967 |
| EP Class B | 4.3 MB | 0.9940 | 0.4 MB | 0.967 |
| MG Class A | 19. MB | 0.9892 | 16. MB | 0.963 |
| MG Class B | net | 0.9794 | 0.4 MB | 0.942 |
| CG Class A | 0.5 MB | 0.9435 | 0.4 MB | 0.937 |
| CG Class B | 66. MB | 0.9449 | 37. MB | 0.932 |
| FT Class A | 1.1 MB | 0.9393 | 0.4 MB | 0.889 |
| LU Class A | 1.1 MB | 0.9830 | 0.4 MB | 0.968 |
| LU Class B | 1.9 MB | 0.9833 | 38. MB | 0.974 |
| SP Class A | 0.9 MB | 0.9919 | 0.4 MB | 0.974 |
| SP Class B | 19. MB | 0.9928 | 16. MB | 0.988 |
| BT Class A | 1.0 MB | 0.9894 | 0.3 MB | 0.993 |
| BT Class B | 2.6 MB | 0.9971 | 16. MB | 0.988 |
Compared to the successes the Fourier transform (FT) is inaccurately predicted by HINT both here and in other benchmarks we have tested that use the Fast Fourier Transform algorithm. We suspect that the power-of-two strides in the address space exercise memory interleave very differently from the manner exercised by HINT. However, a scatter plot of FT versus HINT shows that the relationship is quite predictive and is spoiled by only rare points from the slowest machines:
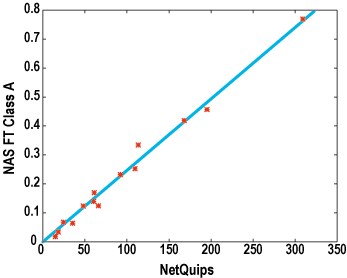
Figure 10. FT versus HINT scatter plot
The following table summarizes our efforts to predict performance of some of the other surveyed benchmarks using all or part of the HINT curve. All tend to sample the extreme left end of the HINT graph..
| Table 7 | ||
|---|---|---|
| Other correlations with HINT | ||
| Benchmark | Best Correlation | HINT Sampling |
| Hanoi | 0.9994 | 88 bytes, integer |
| fft | 0.7474 | 2.3 MB, double |
| Dhrystone | 0.8891 | 88 bytes, integer |
| queens | 0.9924 | 88 bytes, integer |
| Fhourstones | 0.9758 | 88 bytes, integer |
88 bytes is the smallest HINT problem. While small problems are disparaged by serious benchmark practitioners, they continue to resurface from time to time.
We have accumulated several years of experience running the HINT benchmark. To a large extent, it appears that it is a superset of other benchmarks, because excellent predictions of the performance of other benchmarks can be made using either the Net QUIPS or a single-number sample of QUIPS versus problem size.
Correlation tests are slightly hampered by the lack of repeatability in many benchmarks. The drivers usually attempt multiple runs, but often are unable to remove noise in the data. HINT is somewhat unusual in the way noise is detected and removed, and as a result its runs are highly repeatable. Even the 7% variation we saw in SPEC runs is larger than the variation implied by the correlation coefficient between HINT and SPEC, for example.Taken as a positive, this shows that performance prediction accuracy using HINT is more than sufficient for practical purposes.
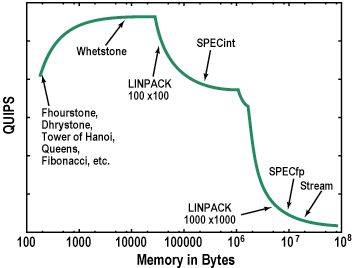
Figure 11. Benchmarks as sample points of a generic HINT graph
Our studies of parallel benchmarks such as the NAS Parallel Benchmarks indicate that HINT has superset capability. Parallel benchmarking is the most expensive kind of benchmarking, because conversions to different parallel architectures can take many person-months. This is where the ease-of-conversion of HINT could produce practical savings without sacrifice of information or accuracy.
We are now beginningwork to find application signatures by linear programming methods instead of by plotting correlation curves. We will adjust the weights at each of the HINT sample points by the simplex method to find the maximum predictive value, and then infer these weights to be the true application signature.
Ultimately, the goal of any benchmark is to correlate closely with application performance, not with other benchmarks. This is our next direction. Because benchmark data is readily available for so many computers, we were able to test our "application signature" idea by testing correlations with HINT curves. We expect to find ways to obtain application signatures automatically and use these to test the predictive power of HINT technology. While we echo the caveat of all benchmarkers that no single benchmark can universally predict performance, we feel this study clarifies the two main dimensions of variability (data type and memory regime) and provides a practical way to reduce the chance of being misled by benchmarks.